Sending custom metrics to Datadog allows you to monitor important data specific to your business and applications, such as latency, dollars per customer, items bought, or trips taken. And tags are key to being able to slice and dice these custom metrics to quickly find the information you need. But collecting enough custom metrics to have complete visibility can be cost prohibitive. For example, you might run microservices instrumented across thousands of containers. Architecture scale-ups, business seasonalities, and unplanned incidents further increase the variability of custom metrics volumes.
Having the deepest level of granularity for all tags and aggregations across every metric may not always be valuable. Now, with Metrics without Limits™, we’ve decoupled custom metric ingestion from indexing, which makes it possible to cost-effectively collect, process, and archive your metrics. You can now dynamically specify which tags across metric names you want to index for analytics and troubleshooting with no agent or code-level changes needed.
Ingest it all, index what’s valuable
Let’s say you run an e-commerce application that emits a metric, basket-size, which represents the number of items sold per transaction. You’ve instrumented custom tags on this metric, such as customer-id, sales-region, user-type. You might have hundreds, or even thousands, of hosts running the web store service that emits this metric. Given that each custom metric has a unique metric name and tag value combination, collecting data across all of these tags can lead to a significant volume of custom metrics that grows as your platform scales.
When monitoring your business, though, you’re probably more interested in reporting the average basket size across specific regions, and less interested in the basket size of a specific customer, or which container the customer’s request was load balanced to. With Metrics without Limits, you can now specify which tags are the most valuable for your analytics. Datadog will then index metrics using those tags—at full, one-second granularity for 15 months—and archive the rest, regardless of how many metrics your environment emits. This lets you maintain your custom metrics volume within your observability budget without, for example, setting up a separate proxy filter at the code level, which can lead to gaps in coverage and risks losing valuable data through this single point of failure.
Easily configure tags across all your custom metrics
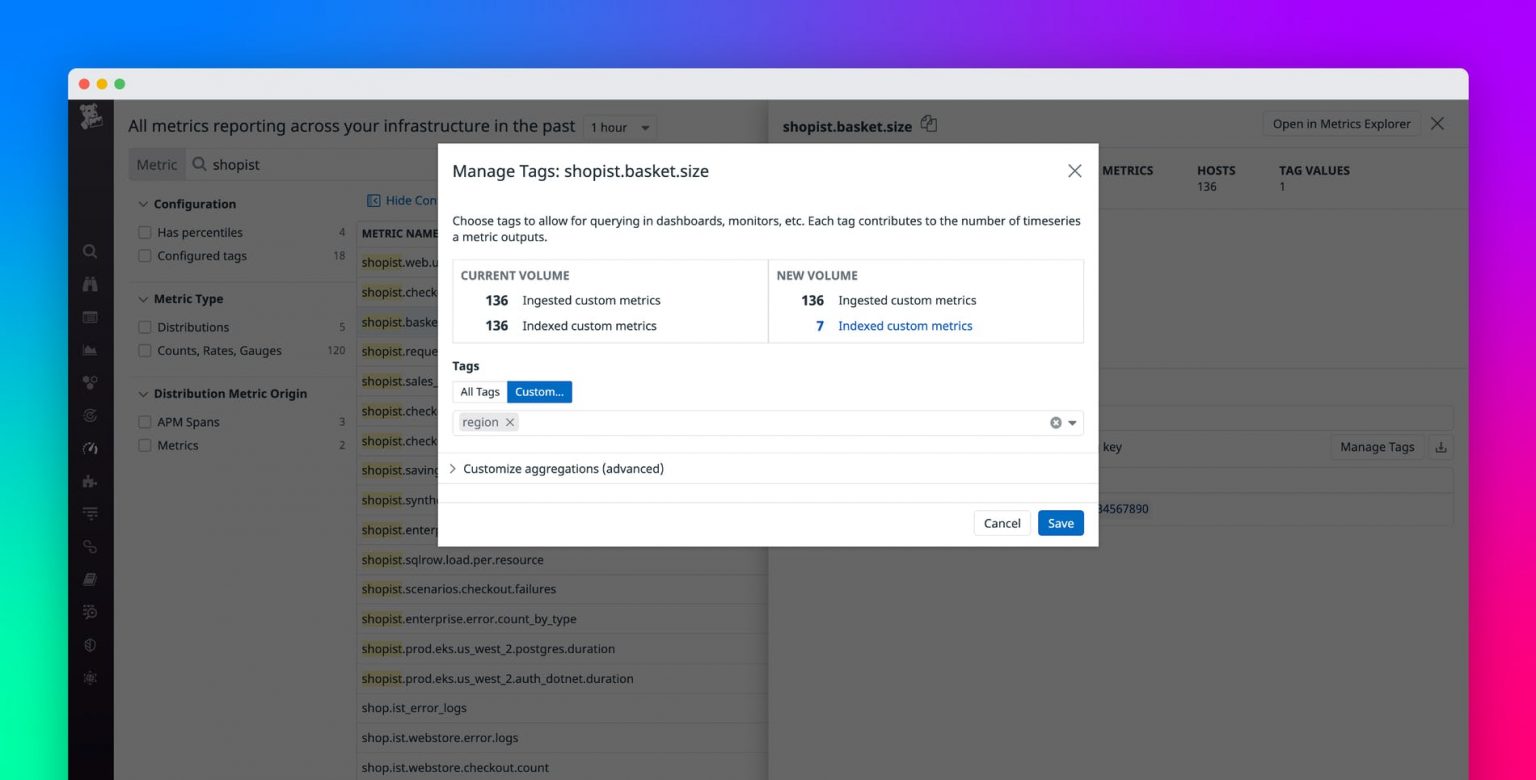
You can easily configure tags for individual metrics, or for groups of metrics all at once. For example, let’s say you have a number of business metrics for your e-commerce site, Shop.ist, such as shopist.basket_size, shopist.sales_completed, and shopist.errors. You may want to analyze this data only by sales region.
By specifying the region tag for all metrics matching the shopist.* namespace, Datadog will automatically index these business metrics only by region. Thus, you will only be paying for custom metrics that contain region and not tags like customer-id or host. When graphing your configured metrics, you’ll see that only region is available for query across the platform.
Fine-tune your indexing with aggregations
You can further adjust your custom metric volumes by defining which metric aggregations you want to query on your count, gauge, or rate metrics. You may not need all aggregations all the time. For example, you may also be interested in the monthly average basket size by region as part of your top-line business health reports, as configured in the screenshot below.
You can easily add or remove aggregations on count, gauge, and rate metrics at any time.
Retrieve your archived data
Metrics without Limits lets you regulate your custom metrics’ volume without losing any information. Datadog continues to ingest all your custom metrics at full granularity, regardless of what filters you put in place, so you can re-index these unindexed metrics at any point for further analytics. For example, suppose you observe a spike in the number of failed checkouts and you actually do want to know which hosts were the cause of this spike.
You could edit your existing configuration on this metric and re-add the host tag to your metric’s configuration to have host-level granularity for your troubleshooting. Datadog then indexes the relevant custom metrics so you can query them moving forward.
Now you can begin troubleshooting by viewing the affected hosts and the related traces and/or logs tied to those hosts.
Start using Metrics without Limits
Metrics without Limits is now available in Datadog. You can get started configuring which custom metrics you want to collect in the Metrics Summary page. This will enable you to quickly answer business-critical questions without having to pay for the overhead of deep dives where you only need occasional insight. If you’re new to Datadog and want to monitor your logs, metrics, distributed request traces, and more in one fully unified platform, you can start a 14-day free trial.


