Whether you are a site reliability engineer or an application developer, you need visibility into the health and performance of every service you run or support. But in complex, dynamic environments, it can be difficult to ensure that all services are accounted for. With Universal Service Monitoring, SREs and other engineers in your organization can get shared visibility into golden signals for HTTP(S) requests across all your services, without redeploying them or touching a single line of code.
Once you enable Universal Service Monitoring, the Datadog Agent automatically parses HTTP(S) messages from the kernel network stack via eBPF. This means that you can easily and securely monitor HTTP request rates, error rates, and latency for all of your existing services—and any new services you deploy—regardless of whether they are instrumented for distributed tracing, and irrespective of programming language.
Universal Service Monitoring collects service health metrics that are useful for creating alerts, tracking deployments, and getting started with service level objectives, so you can get broad visibility into all services running on your infrastructure.
Alerts and SLOs for every service
Once golden signal metrics (request, error, and duration metrics) are flowing into Datadog via Universal Service Monitoring, you can use them to create alerts for all your services, allowing you to quickly respond to issues before they affect your organization. And since Universal Service Monitoring will automatically collect metrics for services as they get deployed in real time, your SRE teams can be confident that Datadog will notify them of possible issues even as your fleet of applications expands.
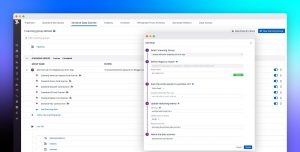
Service level objectives (SLOs) help you track the reliability of your applications so you can define error budgets and set priorities for developing features and improving health and performance. Request throughput, error, and latency metrics are particularly useful service level indicators (SLIs), since they reflect the way users experience your services. Universal Service Monitoring automatically collects these metrics from all services in your infrastructure, making it easy to roll out SLOs across your entire organization. Once you create an SLO in Datadog using a Universal Service Monitoring metric (e.g. trace.core.client or trace.core.server) grouped by the version or service tag, any new service you deploy will automatically include the new SLO. Individual teams can then customize these SLOs for their specific services as needed.
No code changes required
With Universal Service Monitoring, the Service Map now visualizes relationships between all services running on your infrastructure regardless of the programming language they were built with so you can be confident that you have a full view of your architecture. Universal Service Monitoring can be enabled everywhere in seconds, simply by updating a configuration file, allowing SREs to stay on top of even the fastest releasing development teams. The Service Map will show you upstream and downstream dependencies of each service, giving you a complete view of your system architecture.
From here, you can drill down into a specific service to see detailed information about any recent deployments and the health of specific endpoints. This can help you determine if you should scale up underprovisioned infrastructure, for example, or loop in an application’s team to roll back a deployment. Metrics collected via Universal Service Monitoring automatically appear within Deployment Tracking, so you can quickly get more context around the performance of different application versions over time.
Faster troubleshooting with a unified platform
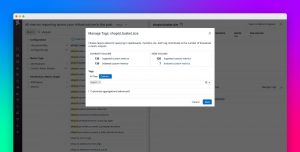
To investigate application health and performance issues, you often need to get context from logs and infrastructure metrics. Universal Service Monitoring automatically tags HTTP request rate, error rate, and latency metrics by environment, service, and version, so you can correlate that data with logs and infrastructure metrics from the deployment you are investigating. Even if you are just learning about a service when it becomes unavailable, you can use this context to get a meaningful idea of what is happening, declare an incident, and give incident responders a head start in their investigations.
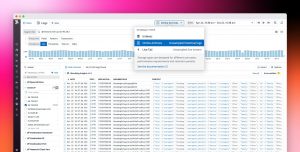
For example, after Universal Service Monitoring helped us detect an uptick in HTTP request errors for version 3.1.4 of our web-store service, we quickly got more context by viewing patterns in the deployment’s correlated error logs, as shown below. The error logs indicated that Redis connection issues were driving most of the service’s HTTP request errors. We can then instrument our web-store service for distributed tracing to see which application path emitted these error messages, helping us prevent similar issues in the future.
No service left behind
With Universal Service Monitoring, you can get comprehensive visibility into the health and performance of all services running on your infrastructure, regardless of whether they are instrumented for tracing. Universal Service Monitoring is in private beta—let us know if you would like to sign up.
While Universal Service Monitoring provides visibility into traffic across all your services, you can get even deeper visibility into individual requests by using our distributed tracing libraries to instrument your applications. Once you’ve enabled distributed tracing, you can use flame graphs to identify sources of latency within individual requests, and Trace Search and Analytics to get detailed insight into trends in application traffic. You can also use Continuous Profiler to get method-level visibility into your application’s resource utilization, even in production.


